
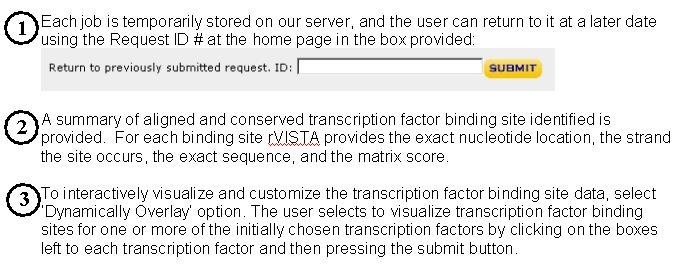
There are 4 different options to run rVista 2.0 (http://rvista.dcode.org)
search for evolutionary conserved transcription factor binding sites. The user can align a pair of genomic sequences from
any specie using zPicture tool and submit alignments for rVista 2.0 processing from the
results page, automatically fetch precomputed alignments from the ECR Browser tool,
submit blastz alignments, or to upload alignments and annotations from
GALA.
Upon submitting
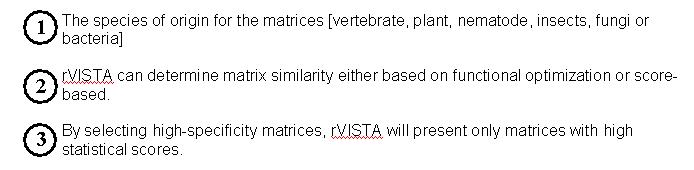
the input data, the user selects the type of transcription factor matrices to
be used for the analysis. We provide
the most current TRANSFAC
database or user can define their own consensus sequences.
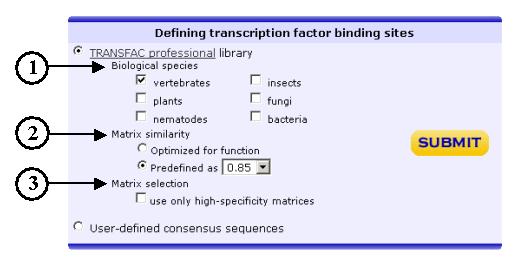
Several options
are available when using TRANSFAC libraries:
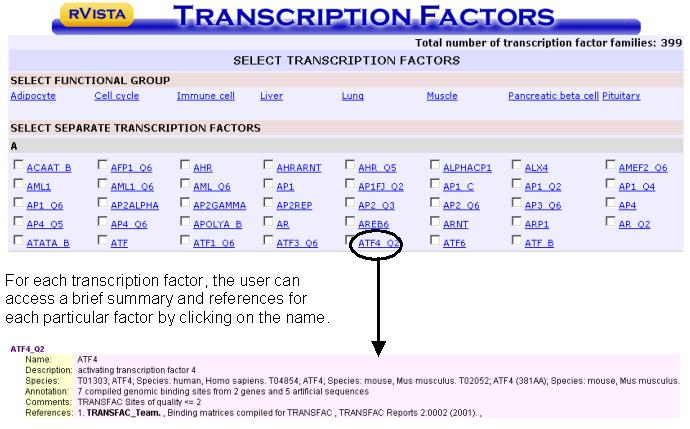
The user is
redirected to a new page that lists all the transcription factor matrices
available in the TRANSFAC database. By
clicking on the boxes left to each transcription factor the user specifies what
transcription factor matrices should be used for the rVISTA analysis. Factors are listed alphabetically, or are grouped into functional
categories [Adipociyte, cell cycle, immune cell, liver, lung, muscle,
pancreatic beta cell or pituitary. By
clicking on a category, all the appropriate transcription factor boxes will be
automatically selected.
When the factor
selection is complete, click on the submit button.

In this example we selected AP1 and GATA3 matrices.

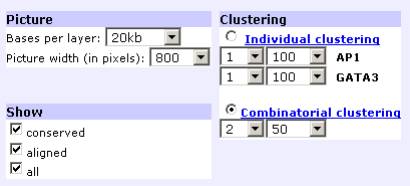
The program allows the user to perform two types of customized clustering: ‘Individual or Combinatorial.’ ‘Individual clustering’ allows the identification of transcription factor binding sites that are present in groups of two or more binding sites for the SAME transcription factor. For example, we can identify pairs of GATA-3 binding sites present in regions of 50 base pairs by selecting 2 and 50 for the GATA-3 transcription factor (1 binding sites = no clustering). Transcription factors are indicated on the left of the graph, highlighted in different colors. TFBS matches from different selected transcription factors (all, aligned or conserved) are clustered and have different color backgrounds.
Individual Clustering
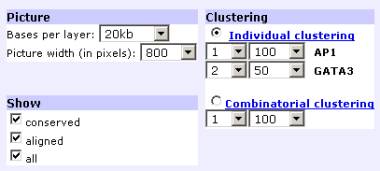
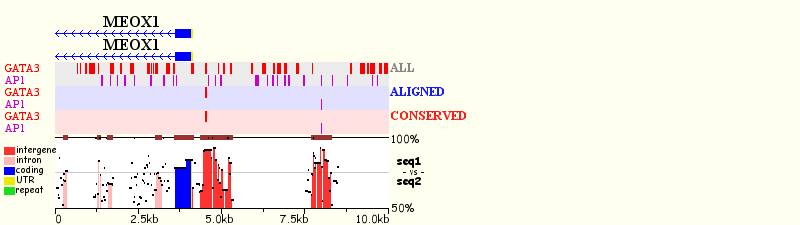
‘Combinatorial clustering’ allows for the identification of transcription factor binding sites that are present in groups of two or more binding sites for DIFFERENT transcription factors. The minimum number of sites in a cluster has to equal the total number of different transcription factors being visualized. For example, if the user chooses to analyze GATA-3/AP-1 clusters of 2 sites/50 bp, the user has to selects 2 sites to be clustered over 50 bp interval. In this case, all the clusters identified will have at least one site of each transcription factor. The criteria indicated represents the minimum allowed number of sites per cluster. For the visualization module, users can also adjust (1) the number of base pairs per layer, (2) picture width (in pixels), (3) type of sites to be visualized (conserved, aligned, all).
Combinatorial Clustering

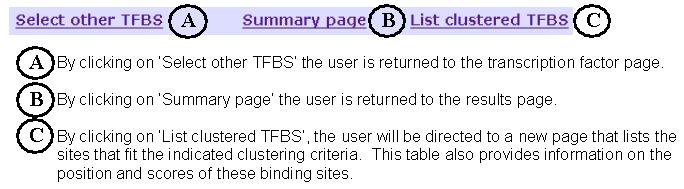
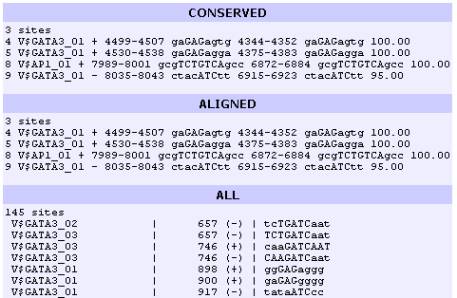
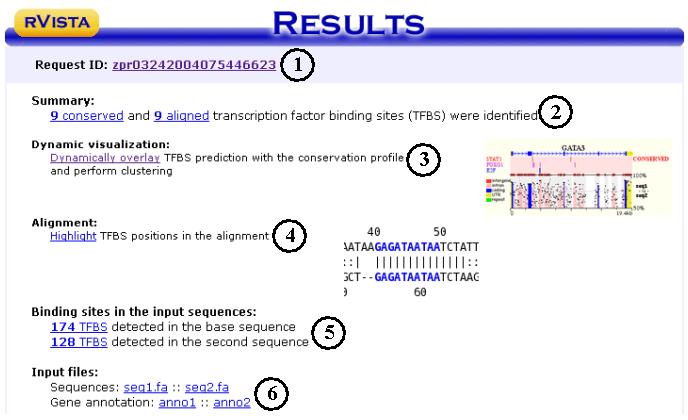
For each
clustering module, the user can display three types of predicted binding sites,
which have different colored backgrounds in the visual display:
Conserved TFBS present in the alignment which are >80%
over a 20 bp DNA region
Aligned Binding sites that align in the alignment
All Binding sites identified for the sequence A or B.